Introduction to HPLC in Peptide Quality Assessment
High-Performance Liquid Chromatography (HPLC) remains the gold standard analytical method for evaluating peptide purity in research settings. For scientists procuring synthetic peptides, understanding HPLC results is essential for ensuring experimental reproducibility and data integrity. This guide breaks down the fundamentals of HPLC purity analysis, how to interpret chromatographic data, and why purity thresholds matter for rigorous research.
How HPLC Works: The Fundamentals
HPLC operates on the principle of differential partitioning between a mobile phase (liquid solvent) and a stationary phase (column packing material). When a peptide sample is introduced into the system, compounds separate based on their physicochemical properties, primarily hydrophobicity in reversed-phase HPLC (RP-HPLC).
The process follows a defined sequence. First, the peptide sample is dissolved in an appropriate solvent and loaded onto the column via an autosampler. A gradient of increasing organic solvent concentration (typically acetonitrile with 0.1% trifluoroacetic acid) then drives the separation. As individual components elute from the column at different retention times, they pass through a UV detector, most commonly set at 214 nm or 220 nm, wavelengths where the peptide bond absorbs strongly.
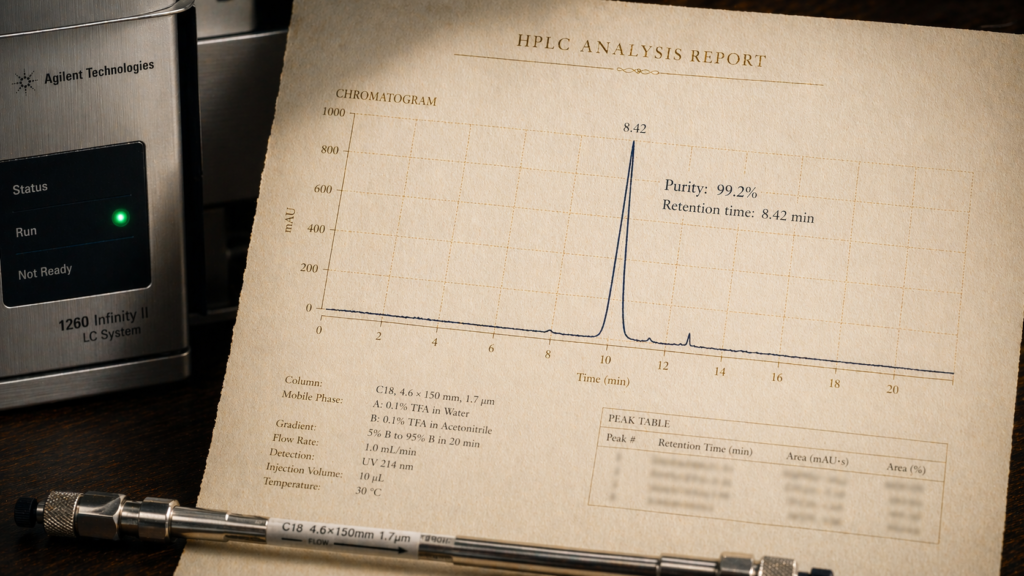
The detector output generates a chromatogram, a plot of signal intensity versus time. Each peak on the chromatogram corresponds to a distinct chemical species in the sample. The target peptide ideally appears as the dominant peak, while smaller peaks represent impurities such as deletion sequences, truncated fragments, oxidized variants, or residual protecting groups (Aguilar, 2004, HPLC of Peptides and Proteins, Methods in Molecular Biology, 251, 3-8).
Reading and Interpreting Chromatograms
A well-resolved chromatogram provides a wealth of information about sample composition. The primary peak, representing the target peptide, should be sharp, symmetrical, and well-separated from neighboring peaks. Several key parameters inform the analysis:
Retention Time (RT): The time at which the target peptide elutes from the column. This value is characteristic of the compound under specific chromatographic conditions and serves as a preliminary identification marker.
Peak Area: The integrated area under each peak is proportional to the quantity of that component. Purity is calculated as the area of the target peak divided by the total area of all peaks, expressed as a percentage.
Resolution: The degree of separation between adjacent peaks. Higher resolution allows more accurate quantification and confirms that the reported purity reflects true separation rather than co-eluting impurities.
Peak Symmetry: Tailing or fronting peaks may indicate column degradation, overloading, or secondary interactions that compromise quantification accuracy.
What Purity Percentages Mean for Research
Peptide purity is typically reported as a percentage derived from HPLC area normalization. Different research applications demand different purity thresholds:
Greater than 95% purity is considered the standard for most in vitro and cell-based assay work. At this level, impurities are unlikely to introduce confounding variables in receptor binding studies, enzyme kinetics assays, or structural investigations. Compounds available at Aureum Peptides are routinely characterized at this tier or above.
Greater than 98% purity is recommended for quantitative structure-activity relationship (QSAR) studies, reference standard preparation, and investigations where even minor impurities could affect results. This level requires additional purification steps, often involving preparative HPLC with optimized gradient conditions.
75-85% purity may be acceptable for preliminary screening or sequence confirmation, but researchers should note that impurities at this level can include closely related deletion peptides that may exhibit partial biological activity, potentially complicating data interpretation (Mant & Hodges, 1991, High-Performance Liquid Chromatography of Peptides and Proteins: Separation, Analysis, and Conformation, CRC Press).
Common Impurities Detected by HPLC
Understanding the nature of impurities helps researchers assess their potential impact on experimental outcomes. The most frequently observed impurity classes include:
Deletion peptides arise when a coupling step fails during solid-phase synthesis, resulting in sequences missing one or more amino acid residues. These can be particularly problematic because they may retain partial activity in functional assays.
Oxidized species form when methionine, cysteine, or tryptophan residues undergo oxidation during synthesis, cleavage, or storage. These typically appear as earlier-eluting peaks on RP-HPLC.
Diastereomers result from racemization at chiral centers during coupling reactions. These can be especially difficult to separate chromatographically and may require specialized column chemistries for detection (Verbeke et al., 2015, Analytical Chemistry, 87(5), 2867-2873).
Complementary Analytical Methods
While HPLC provides excellent quantitative purity data, it is most informative when combined with complementary techniques. Mass spectrometry (MS) confirms molecular identity, ensuring the main HPLC peak corresponds to the correct target sequence. Amino acid analysis (AAA) verifies composition, and capillary electrophoresis (CE) can resolve species that co-elute under HPLC conditions.
A comprehensive Certificate of Analysis, such as those provided with all Aureum Peptides products, includes HPLC chromatograms alongside mass spectrometry data, giving researchers a complete picture of compound quality and identity (Rathore & Winkle, 2009, Nature Biotechnology, 27(1), 26-34).
Best Practices for Evaluating HPLC Data
When reviewing HPLC results, researchers should verify that the analytical conditions are reported, including column type, mobile phase composition, gradient parameters, flow rate, and detection wavelength. Integration parameters should use consistent baseline assignments. The chromatogram itself should be available for visual inspection, not just a reported percentage. Peak identification by retention time should be confirmed with an orthogonal method such as LC-MS (Crimmins & Bhatt, 2001, Current Protocols in Protein Science, Chapter 11, Unit 11.7).
Conclusion
HPLC purity analysis is a foundational quality metric in peptide research. By understanding how chromatographic data is generated and interpreted, researchers can make informed procurement decisions and better assess the reliability of their experimental outcomes. A commitment to analytical rigor, from synthesis through final quality control, ensures that research-grade peptides meet the standards demanded by contemporary scientific investigation.
For research use only. Not for human consumption.